

And The Oscar (on YouTube) Goes To...
For the second year running, we’ve teamed up with YouTube to analyze how people engage with movie-related content on the platform, in advance of Hollywood rolling out the red carpet for the 2017 Oscars. Our analysis coincides with release of YouTube’s special-edition Movie Trailers Leaderboard, which ranks the top performing Best Picture nominee trailers on YouTube. Let’s dive into how fast Hollywood’s online proxy is growing, how publishing trends differ by quarter, comparative performance of movie content types, and a specific look at movie trailer performance.
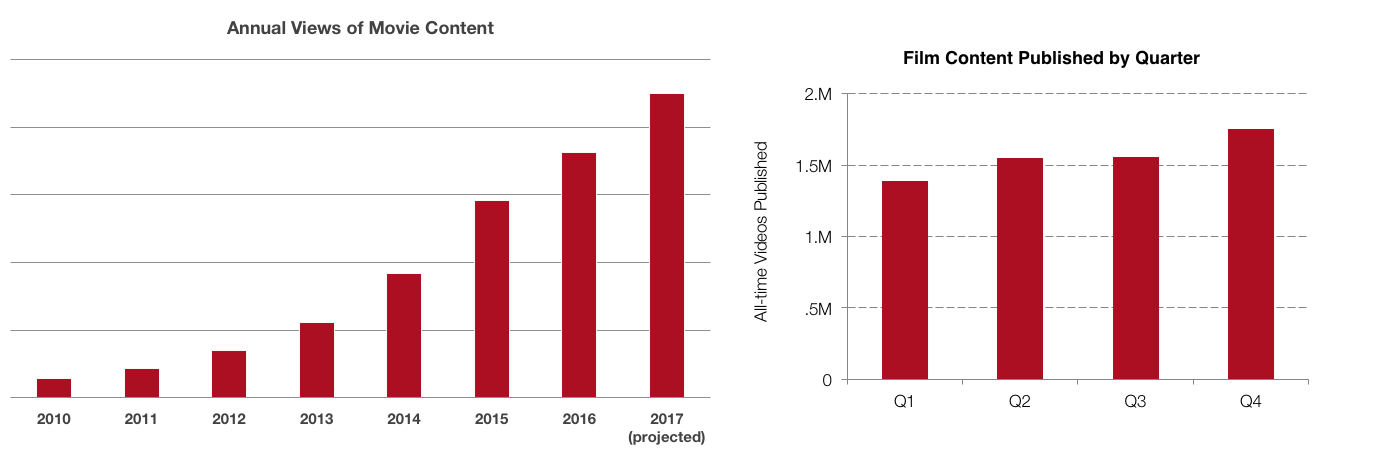
Our data shows that YouTube continues to be a major destination for consumption of movie-related videos, with annual views of movie content projected to grow more than 24% in 2017. Similar to last year, we continue to see noticeable increases in movie content published on YouTube in Q2 compared to Q1 (around those summer blockbusters), and again in Q4 over Q3 (for the holiday hit movies).
For our analysis, we segmented movie content on YouTube into four types: clips, music, trailers, and user-generated content (UGC, which includes plot suggestions, fan-made videos, etc.). We looked at audience engagement (which we define as the sum of YouTube likes, dislikes, comments, and shares) of these content types and found that music videos (which includes official song clips from the movie, videos on the artist or label’s channel, and UGC music content) edge out trailers for the number one spot, with a 1.43% engagement rate compared to 1.4% for trailers. This year’s interest in music is no surprise given the popularity of the soundtracks of 2016 blockbusters “La La Land” and “Hidden Figures.”
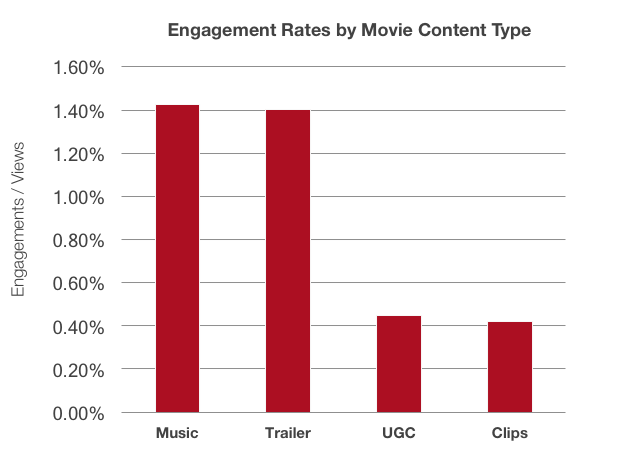
If you switch lenses and measure the four content types by number of videos and views though, trailers lead, followed by UGC, clips, and finally music. So interestingly, though music videos are the least-viewed of the four categories, they’re the most engaging.
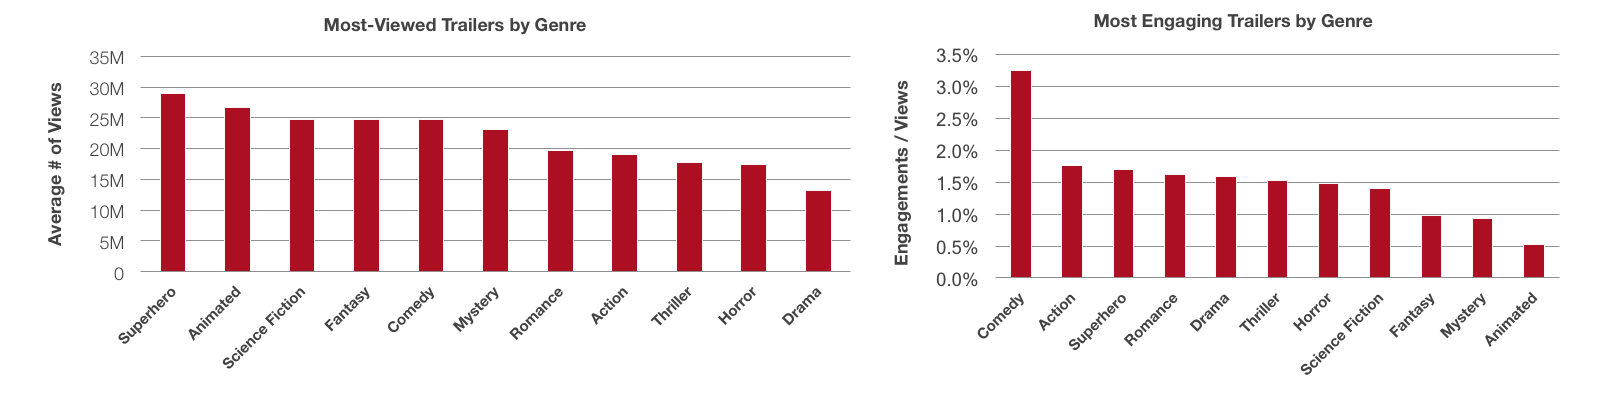
We now know that trailers attract the eyeballs, so what specific genre of trailers performs best? Superhero trailers reign supreme (measured by average views per video) at 29M, followed by animated movie trailers at 26M. While comedy trailers only rank fifth in views per video, they generated the highest engagement rate by far in 2016, leading the pack at 3.26% (action trailers fall in second place at 1.76%). This is largely due to the success of “Ghostbusters,” which was the year’s best-performing comedy video with a whopping 4.67% engagement rate; “Bad Moms” and “Neighbors 2” also contributed to comedy trailers’ engagement success. Surprisingly, while animated trailers were the second most-watched genre, they generated the lowest engagement rate.
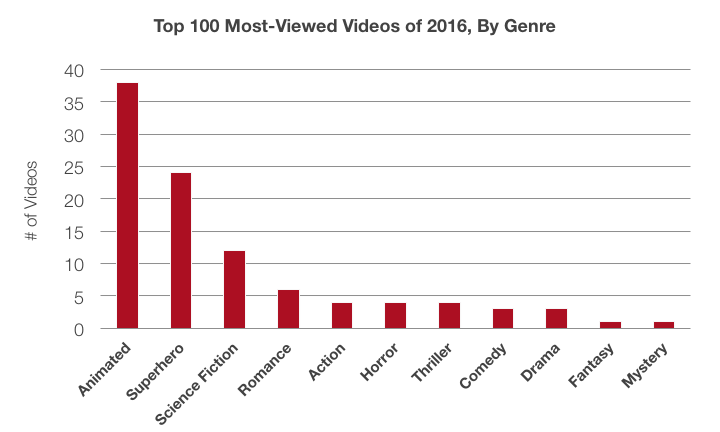
Now let’s take a look at 2016’s top 100 most-viewed movie videos, and which genres performed best. Animated movie videos ruled, followed by superhero and science fiction videos. Combined, the three genres account for 74 of the year’s top 100 movie-related videos.
So now that we’ve sliced the movie space on YouTube from several angles, what’s an advertiser to do with all this information? The insights gleaned from the data can inform content strategy — isolating what content types perform best in a given space — and can guide campaign targeting — identifying the contextual and placement targeting that’s proven to yield the best results, specific to campaign objectives. If you’re in the entertainment business and need help doing just that — or if you could benefit from similar insights for a different industry — get in touch today!
And in the meantime, head over to Think with Google to see which Best Picture nominee trailer claimed the number one spot in the special-edition Oscars Leaderboard.